View Population Densities in Mid-Atlantic Coastal Watersheds
Portal users can now see how population densities line up with key ports, beach resorts and other coastal features in the Mid-Atlantic and Northeast with Marine Planner.
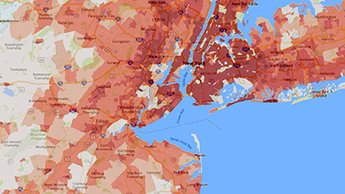
The new Population Density map shows how many residents live per square mile, with the darkest reds representing areas with more than 10,000 people and the lightest pinks indicating fewer than 500. The map, which draws on U.S. Census statistics, covers areas from North Carolina to Maine that are defined as coastal watershed counties by the National Oceanic and Atmospheric Administration.
Users can also click on the map for a pop-up window containing specific statistics for a particular Census tract. These include the tract’s 2015 estimated population, population per square mile and total square mileage, as well as 2010 Census figures for the total population, median age, total number of households and housing units.
The Population Density map is currently one of two available within the Portal’s Socioeconomic data theme. The Ocean Economics GDP map debuted in March, with plans to add more Socioeconomic data in the future.
Share this story