
The cetacean data products developed by the Marine life Data & Analysis Team (MDAT), including all summary products, now include the latest North Atlantic right whale models developed by the Duke University Marine Geospatial Ecology Lab (MGEL). In addition, the MDAT cetacean sound sensitivity species group products have been updated based on the findings of a recent journal article (Southall et al., 2019).
To view the North Atlantic right whale maps, open the Marine Life Library (Species Specific) theme, click the dropdown for “Marine Mammal Abundance” or any of its associated confidence levels (e.g., “Marine Mammal 5th Percentile,” “Marine Mammal 95th Percentile”) and begin typing "North Atlantic right whale." Upon keying in the first few letters, you’ll be presented a list of monthly map layers to select from. To view the summary products for groups (e.g. “All Cetaceans,” “Baleen Whales: Abundance”), open the Marine Life theme and click the “Marine Mammals” dropdown.
The Portal’s cetacean data products have been updated several times since 2016. A new North Atlantic right whale model was created by MGEL in fall 2021 with funding from the Navy and NOAA and was reviewed by species experts. MDAT used these model outputs to update the Total Abundance and Species Richness products for all cetacean species groups, including ESA-listed species, Baleen Whales, and others. Additional details on the individual species models and summary products can be found in the MDAT Technical Report. For specific details on the updates to the individual species model for North Atlantic right whale on the Portal (version 11.1), see below and visit the MGEL model history page.
Updated North Atlantic Right Whale Layers
The new North Atlantic right whale new model density maps summarize the era 2010-2018, reflecting the apparent major shift in right whale distributions around 2010. This 2010-2018 era is the recommended density surface for management decisions. For comparison, results were also summarized for two additional eras, 2003-2009 and 2003-2018. These other results are available for download from the model history page.
Model resolution was increased to 5km X 5km grid cells, while the prediction units remain the number of animals/100km2. Summary products for groups that include North Atlantic right whales remain at standard 10km X 10km grid cell resolution. In addition to updating the methods for modeling the density predictions and uncertainty products, the following additional changes were made to the right whale models:
- Updated density predictions for Cape Cod Bay for January-May use estimates from Ganley et al. (2019). Predictions for the month of December use all surveys conducted by the Center for Coastal Studies during the month of December from 2003-2020.
- Additional survey data were added, and the aggregate database of surveys now extends through spring of 2019.
- The study area was extended farther inshore in certain bays and estuaries, per NOAA’s request.
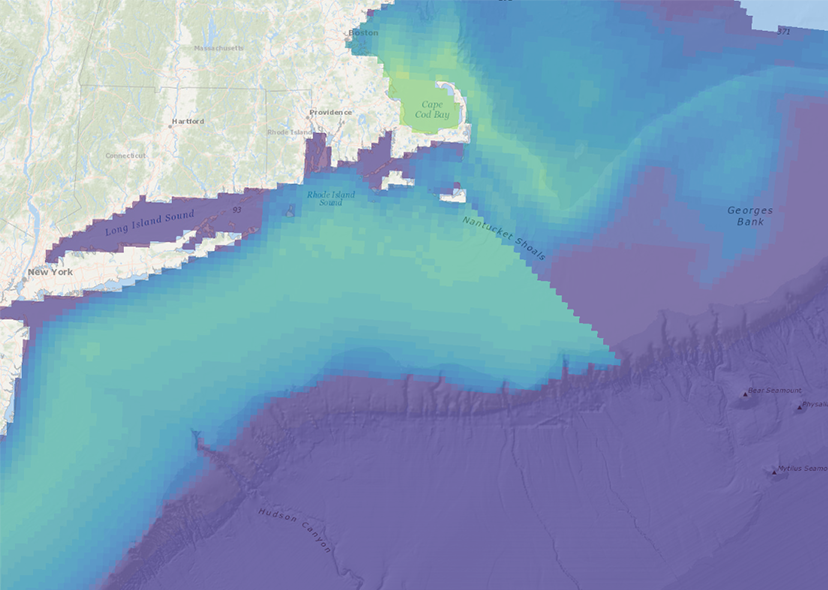
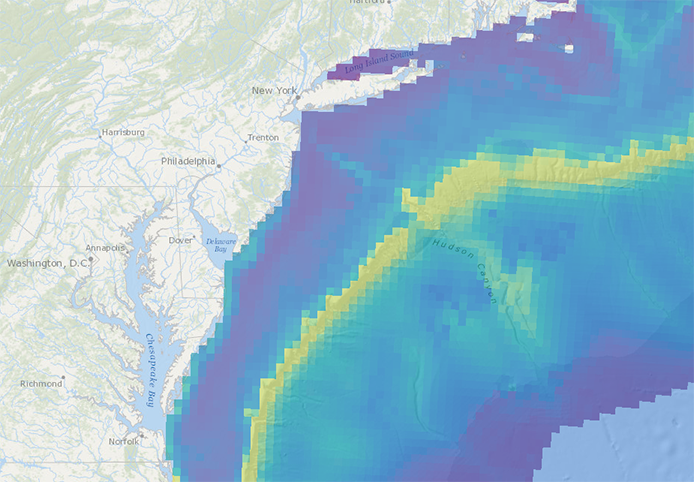
Users may notice that some of the North Atlantic right whale monthly layers contain linear patterns extending from Nantucket Shoals out to the shelf break (see image at right). This pattern is the result of the boundary between model domains that was used to best represent right whale numbers north and south of Nantucket. As noted in the model documentation, this is an area where right whale densities have been changing in recent years and so caution should be used when interpreting predicted density values near this boundary. For questions regarding model interpretation in this area or in general, contact Jason Roberts at Duke MGEL (jason.roberts@duke.edu).