Registered Portal users can now import GIS files from their desktops in addition to drawing and saving polygons, multi-segment lines and points with the Shapes tool, accessible via a quick start button and in the MyPlanner tab in Marine Planner. The tool, formerly called “Drawings,” has been expanded in response to user requests for an option to import data such as shape files and latitude/longtitude coordinates to the Portal.
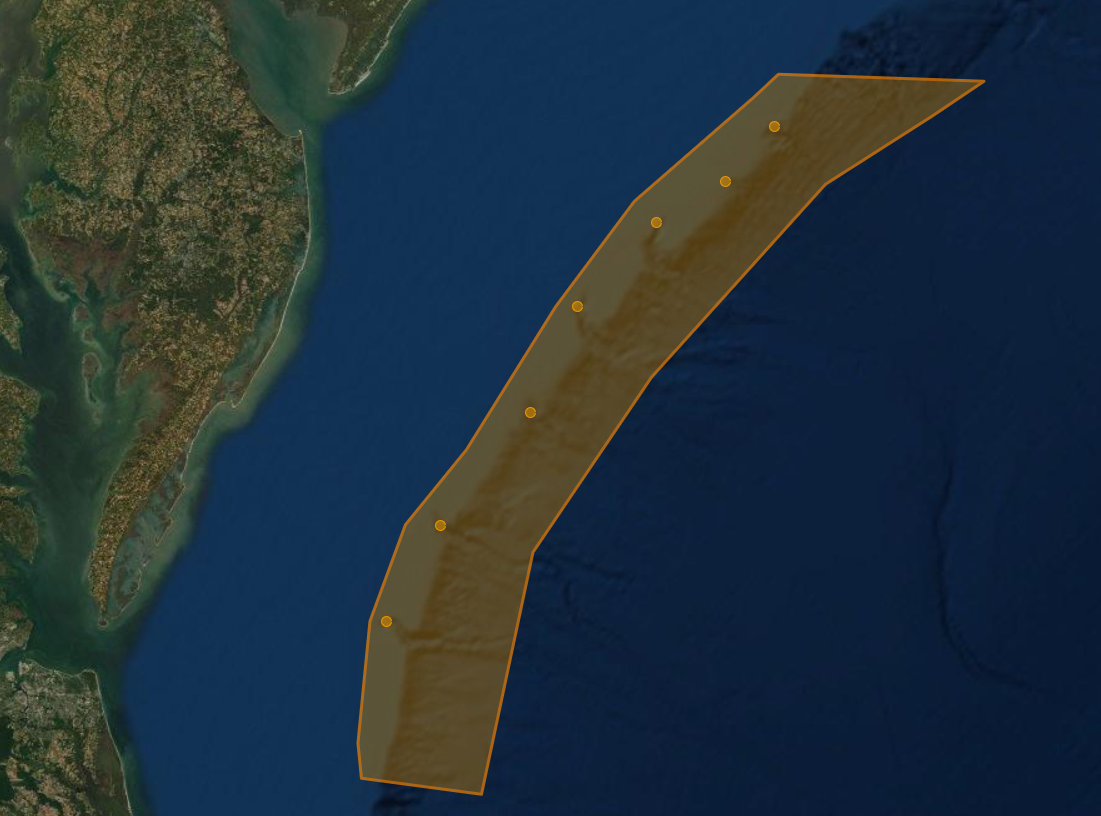
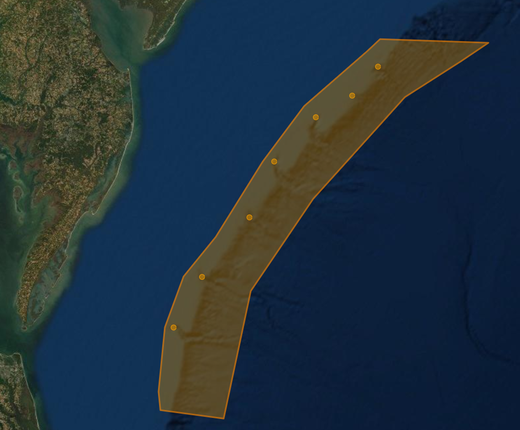
The Shapes tool enables users to highlight discoveries they’ve made on the Portal’s data maps – for example, by drawing boundaries or points to mark areas where strong overlap is found between human activities and natural features at sea. With just a few clicks, users can share these shapes with fellow members of Portal Groups or export them for use on their own GIS software.
The tool also offers users an easy way to directly compare data from their own ESRI Shapefiles, KML, GeoJSON, CSV and TSV files with the thousands of map layers available on the Portal. Users can click on polygons they’ve created or imported to learn the square mileage of the area, points for their coordinates, and lines for their length in miles. (You can also use the Linear Measurement Tool to get distances in nautical miles and kilometers.) Distances and square mileage figures should be assumed to be approximate.
Shapes that were previously created and saved with the Drawings tool can now be accessed by clicking the Shapes dropdown in the MyPlanner tab.
Using the Tool
To use the Shapes tool, follow these easy steps:
Step 1
Click on the New Shape button in the top right of Marine Planner or select the MyPlanner tab and click +NEW next to the Shapes heading.
Step 2
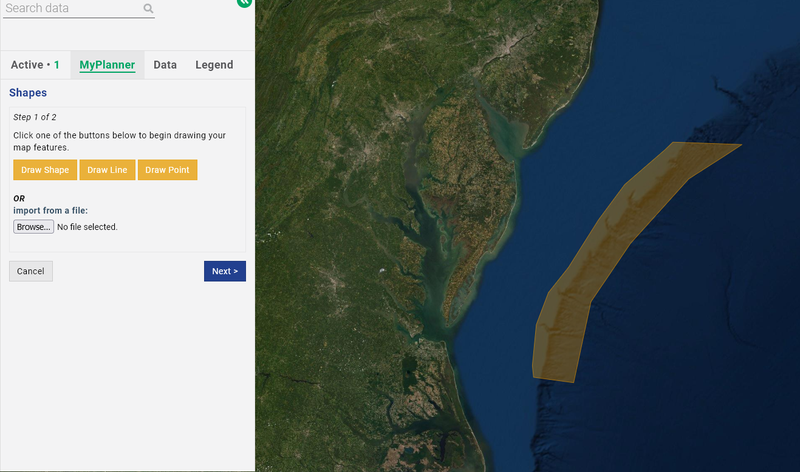
Click Draw Shape, Draw Line, Draw Point or Import from a file.
For drawing shapes, lines or points: Point the cursor to the spot where you’d like to start your drawing and click on the map. For shapes and lines, extend the line to the next spot you’d like to use as a boundary and click on the map again. Continue clicking spots to create your desired shape and double click to place your last point. Note that you can pause drawing and zoom in or out as needed to ensure the accuracy and placement you need.
For importing a file: Click the “Browse” button and select an ESRI Shapefile (zipped in .zip format), KML, GeoJSON, CSV or TSV file from your computer. A pop-up will advise on any technical specifications for the selected file type, such as size limits or formatting parameters. (Note: Attribute data included in the files will not be imported.)
Step 3
Your data will now appear on the screen. Click Next if you’re satisfied with the shape. For shapes created in Marine Planner, you can click Edit Shape if you’d like to make adjustments or Add Shape if you’d like to add more parts to it.
Step 4
Give your shape a name and add any notes explaining its meaning or purpose to the Description window (optional). You may also choose a custom color and opacity level to control how it appears. Click Save when finished.
To activate your shape in future sessions, click Shapes in the MyPlanner tab for a dropdown list of all of your files. You can edit a shape at any time by clicking the gear icon to the right of its title.
Share Your Work
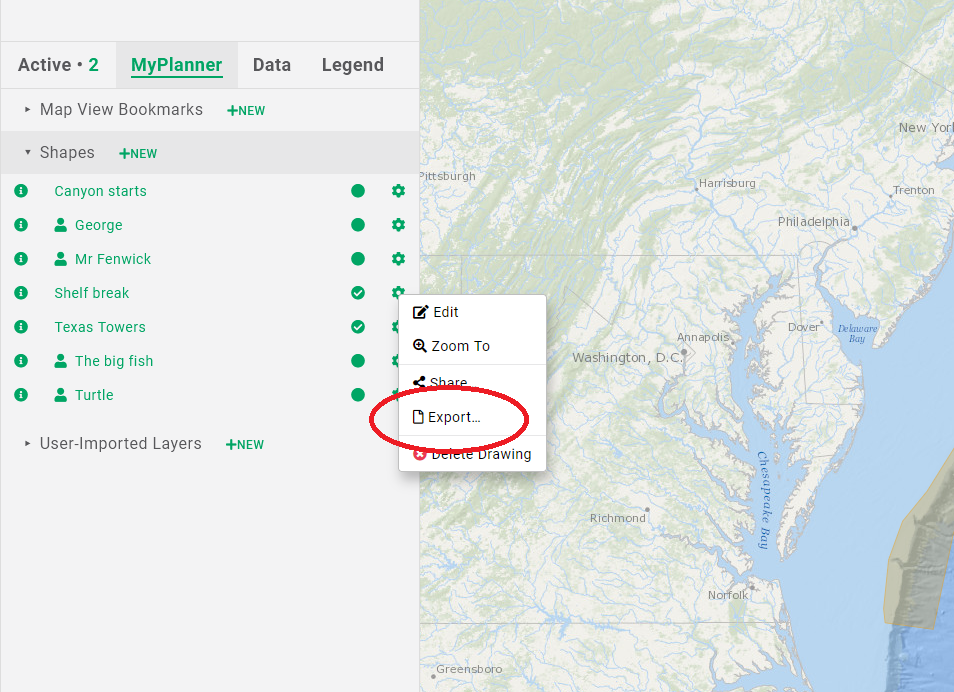
Your shapes will not be visible to other users unless you choose to take advantage of the Portal’s many sharing options. You can make your work available to fellow members of any Portal Group you’ve joined by clicking on the gear icon and selecting Share.
Shapes can be downloaded in three file types — Shapefile, GeoJSON and KML — by clicking on the gear icon and selecting Export. This function makes it possible for users to conduct their own participatory mapping projects and share information about important ocean places using common GIS-based software systems, database programs, mapping applications such as Google Earth, and more. More information on each of the three file types can be found by clicking on the green question mark icon next to each item.
This tool will continue to be improved and expanded to allow for the import of additional data types. Users can also import published map data from external websites using the Portal’s Map Layer Import Tool.
Questions or Comments?
How are you using the Drawings tool? Are you experiencing any difficulties with it? Let us know at portal@midatlanticocean.org.