The Mid-Atlantic Ocean Data Portal has added 350 interactive map layers that model annual and monthly impacts of fishing gear on the seafloor as well as the types of sediments commonly found along the bottom of ocean areas and estuaries throughout the region.
The maps and data products were first published by the Northeast Ocean Data Portal, in collaboration with the New England Fishery Management Council (NEFMC), and are derived from the Northeast Fishing Effects Model (Fishing Effects).
Fishing Effects represents the second generation of a framework that enables fishery managers to better understand the nature of fishing gear impacts on seabed habitats, the spatial distribution of seabed habitat vulnerability to particular fishing gears, and the spatial and temporal distribution of realized adverse effects from fishing activities on seabed habitats. Fishing Effects builds on the methods and results of the Swept-Area-Seabed-Impact (SASI) model developed in 2011 by the NEFMC Habitat Plan Development Team. Fishing Effects combines seafloor data (sediment type, energy regime) with parameters related to the interactions between fishing gear and seafloor habitats to generate habitat disturbance estimates in space and time.
Three types of data and maps are available in Marine Planner’s Seafloor Habitat theme: Sediment Type, Percent Seabed Habitat Disturbance, and Intrinsic Seabed Habitat Vulnerability.
Sediment
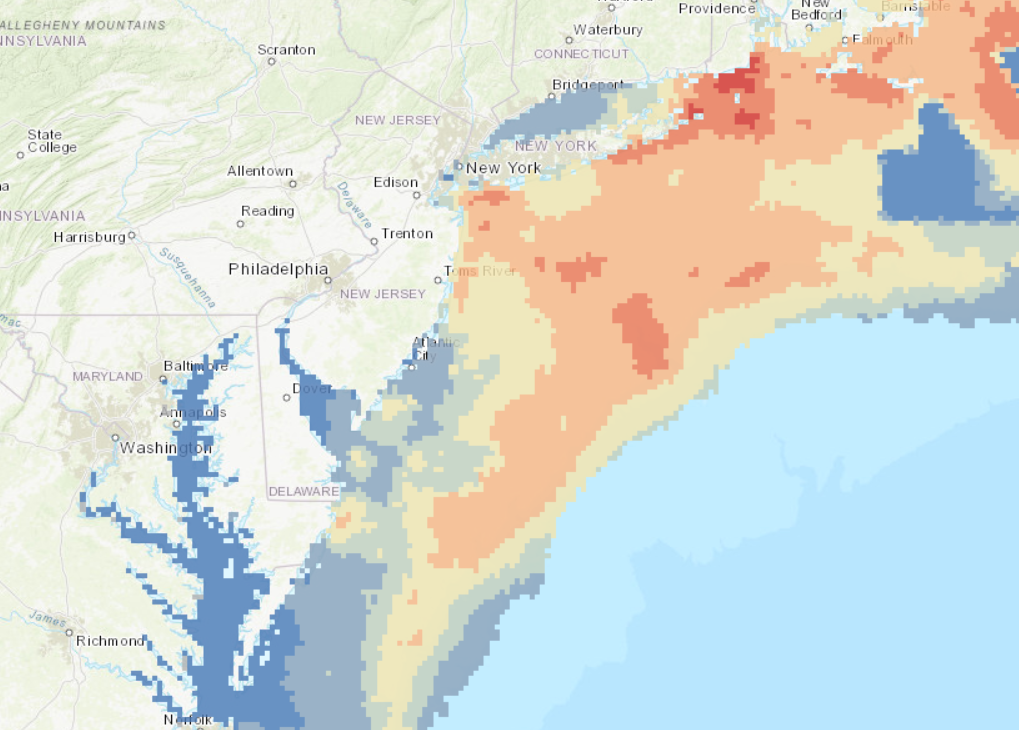
Sediment data and maps include: Percent Sediment Type for mud, sand, granule and pebble, cobble, boulder, and steep/deep habitats; Sediment Diversity; and Sediment Data Density. These layers constitute a portion of the input data for Fishing Effects and its primary purpose is to serve as a base layer for that model. A secondary purpose for these maps of sediment grain sizes is to inform various spatial planning issues where seabed type is a consideration for decision making. The grain size distribution was modeled based on available data (primarily from the USGS and SMAST drop camera survey dataset, and also from various sediment polygon data sources). The Sediment Diversity layer provides a rough indication of the diversity of sediment types within a cell. The Sediment Data Density layer essentially serves as a data quality assessment, so users can visualize the limitations associated with both the underlying source data and this compilation when using the data for spatial planning.
Percent Seabed Habitat Disturbance
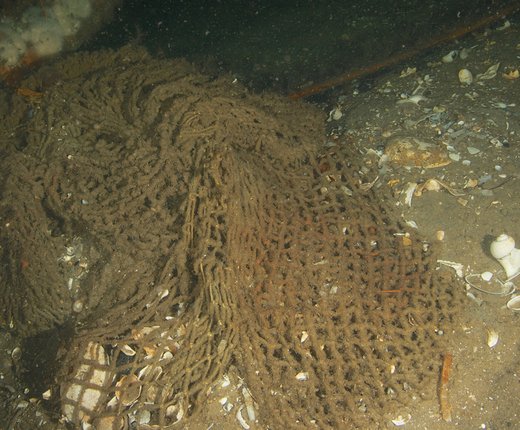
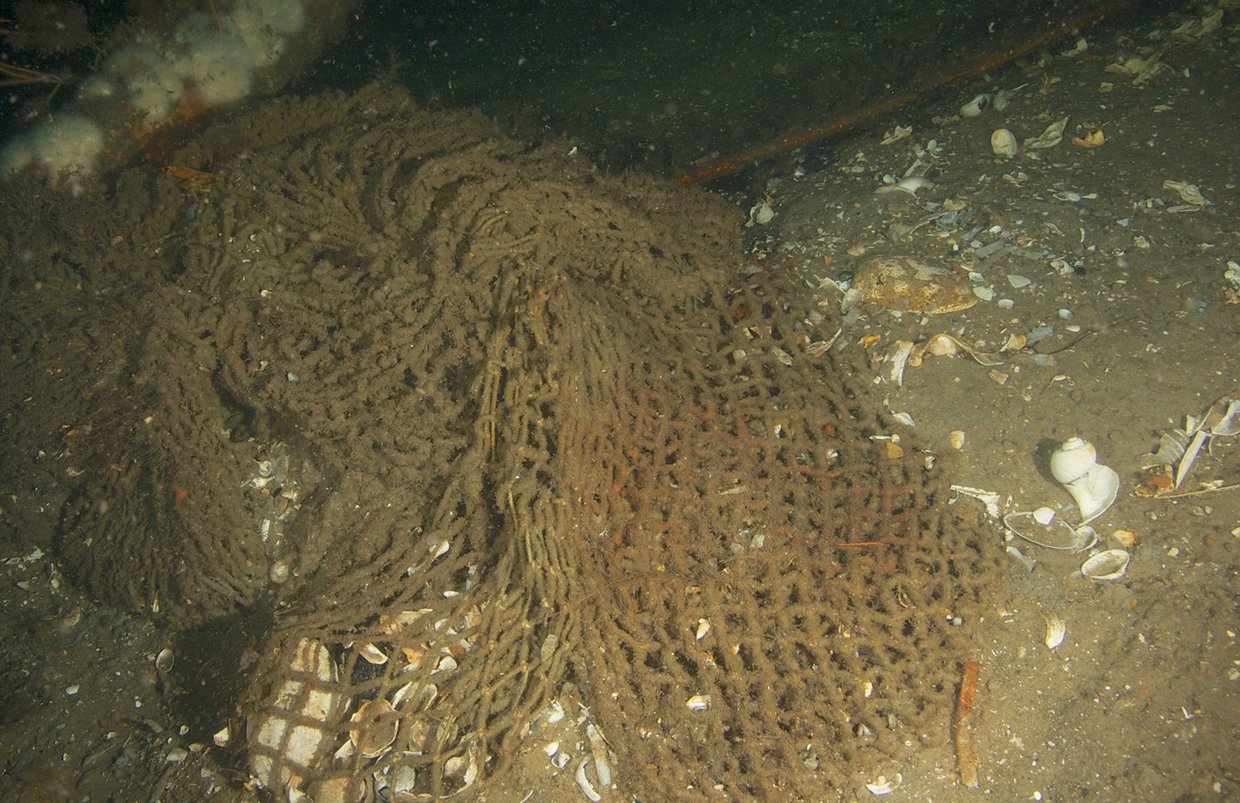
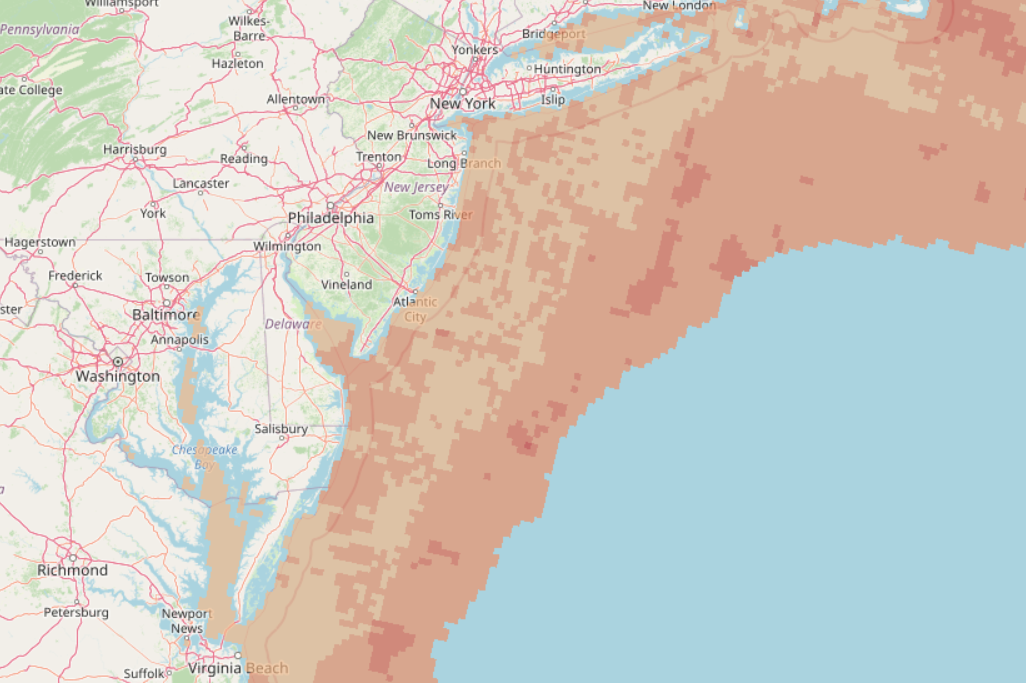
The Percent Seabed Habitat Disturbance layers show estimated disturbance to the seabed according to six different bottom-tending fishing gear types (bottom trawl, scallop dredge, hydraulic clam dredge, longline, gillnet, and trap). There is also a combined output where all fishing effort across the six gear types is run through the model at once, and the outputs are monthly percent disturbance by grid cell across all bottom-tending gears. Time sliders in the Portal show monthly model outputs for three years (2015, 2016, 2017). Users can toggle conveniently between gear types and months or click a play button to automatically animate the map and cycle through the year. (Click here for tutorial on the Portal’s slider and animation tool.) The value of each cell represents the proportion of intact seabed habitat that is disturbed during each time step. The proportion of disturbed seabed habitat increases over time because disturbance in each time step of the model is calculated based on the disturbed and intact habitat from the previous time step.
Intrinsic Seabed Habitat Vulnerability
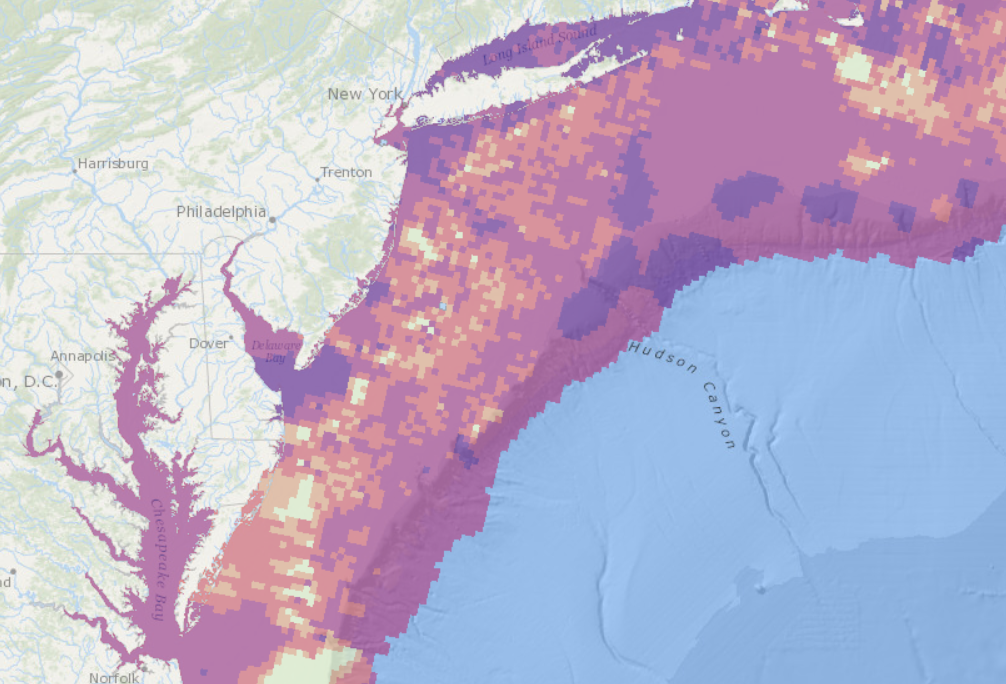
The Intrinsic Seabed Habitat Vulnerability to Fishing layers show the vulnerability of the seabed to each of six bottom-tending fishing gear types (bottom trawl, scallop dredge, hydraulic clam dredge, longline, gillnet, and trap). A higher habitat disturbance percentage suggests that the seafloor in that location is more vulnerable to that fishing gear. The maps in the Portal show the estimated percent seabed habitat disturbance for each of these six gear types by grid cell for the final month of the time series (December 2017). This type of product is of value to managers because fishing effort is influenced by numerous factors which are subject to change, including spatial closures that prohibit certain types of gear in specific locations. The intrinsic vulnerability products allow the Council to predict which areas would be vulnerable to impact, even in the absence of existing fishing pressure.
For more information, visit the NEFMC Fishing Effects Model page and read the Northeast Fishing Effects Model report.