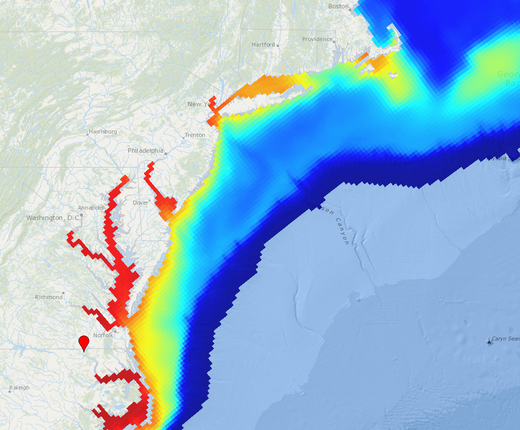
MARCO and MARACOOS have published a series of new maps on the Portal that estimate average monthly sea bottom temperatures in ocean and estuarine areas from Nova Scotia to Cape Hatteras. The maps are the product of long-standing partnership between MARACOOS, which offers real-time ocean observation data through its OceansMap, and MARCO, which offers map products that support long-term regional ocean planning through the Portal.
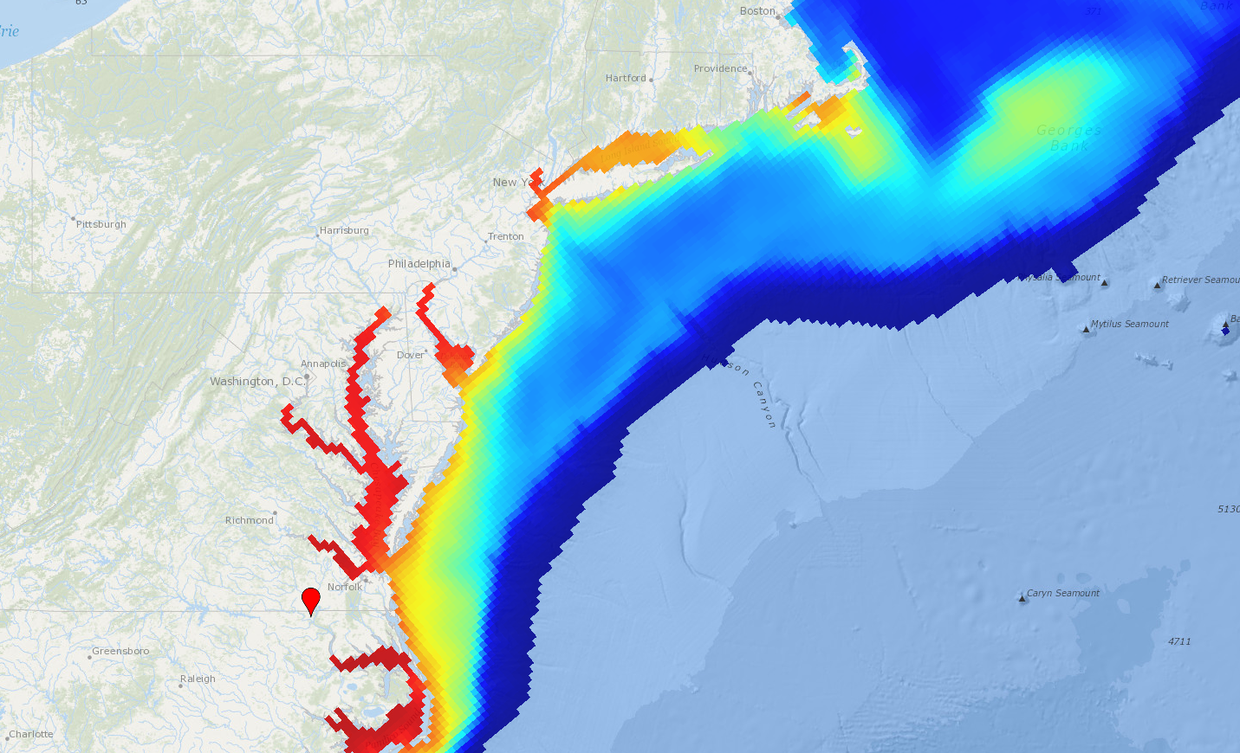
The MARACOOS Bottom Temperature Monthly Slider maps were created by averaging 13 years of daily model-based data analysis into 12 monthly ensemble mean maps that users can automatically animate or toggle through manually. The maps also offer a view of the approximate extent of the “cold pool,” a band of cool water found off the Mid-Atlantic coast in the spring through fall that is critical to marine life and fisheries.
The data displayed is derived from the “Doppio” model developed by the Rutgers University Ocean Modeling Group for MARACOOS. The model has been run for the time period January 2007 through present and produces an hourly estimate based on a combination of data, including observed readings for bottom temperatures, surface currents, sea surface temperatures, salinity and other indicators, as recorded by instruments mounted on satellites, buoys, gliders, vessels and other sources.
The maps can be found in the Oceanography theme in Marine Planner. After clicking on the MARACOOS Bottom Temperature Monthly Slider layer, click the “View Slider” button to control the map layers in the Active tab. (Click here for a tutorial on using the Slider & Animation tool.)
The release of the bottom temperature data is the latest instance of MARACOOS and MARCO teaming to produce oceanographic map products that accommodate the needs of stakeholders by leveraging the complementary functions of the OceansMap and Portal. The Portal published a series of map layers in 2020 showing average surface currents by season based on hourly measurements collected by MARACOOS’ Mid-Atlantic High Frequency Radar Network from 2007-16. In 2019, the organizations partnered to create a dozen maps depicting average monthly sea surface temperatures based on 15 years of recent data.
For more information on these maps, email portal@midatlanticocean.org.