Explore the Mid-Atlantic’s sea bottom in greater detail than ever before with four new maps in our Oceanography theme. We’ve added two high-definition bathymetry maps covering the full East Coast and a pair of maps illustrating natural sediment drift in offshore areas from southern New England to North Carolina.
The bathymetry layers were created by the National Oceanic and Atmospheric Administration’s (NOAA) National Centers for Environmental Information (NCEI) and the sediment layers were created with data from the U.S. Geological Survey Sea Floor Stress and Sediment Mobility Database.
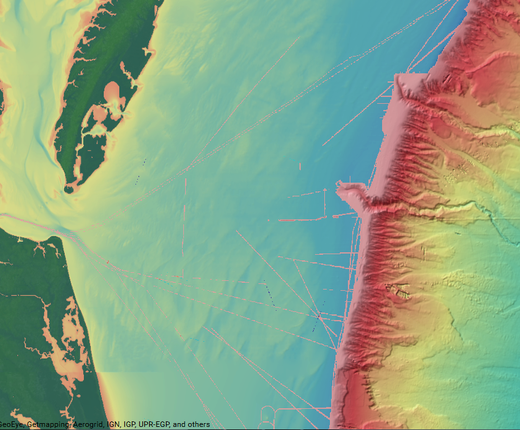
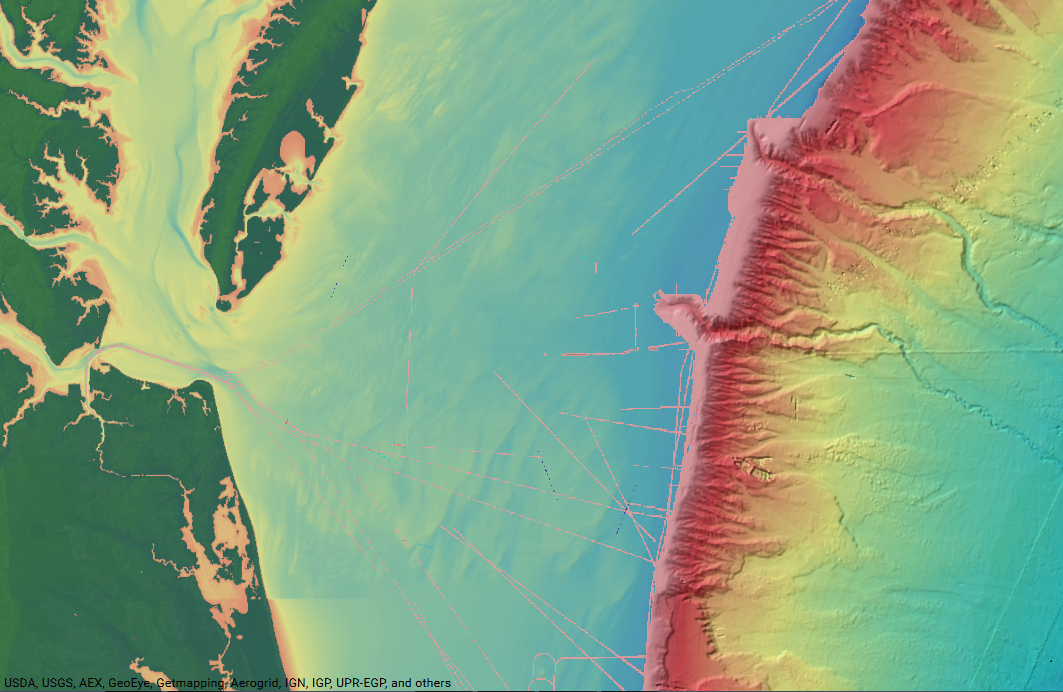
The NCEI Multibeam Archive layer focuses primarily on areas from the continental shelf break and canyons on out to areas beyond the 200 nautical mile Exclusive Economic Zone. It contains bathymetry data for several deep-sea features of the Atlantic, such as the New England Seamounts and the Mid-Atlantic Ridge. The data was acquired from both U.S. and international government and academic sources. The NCEI Topographic and Bathymetric Mosaic map pairs data depicting the sea bottom from the shelf break to the shore with data showing land elevations along the Eastern seaboard.
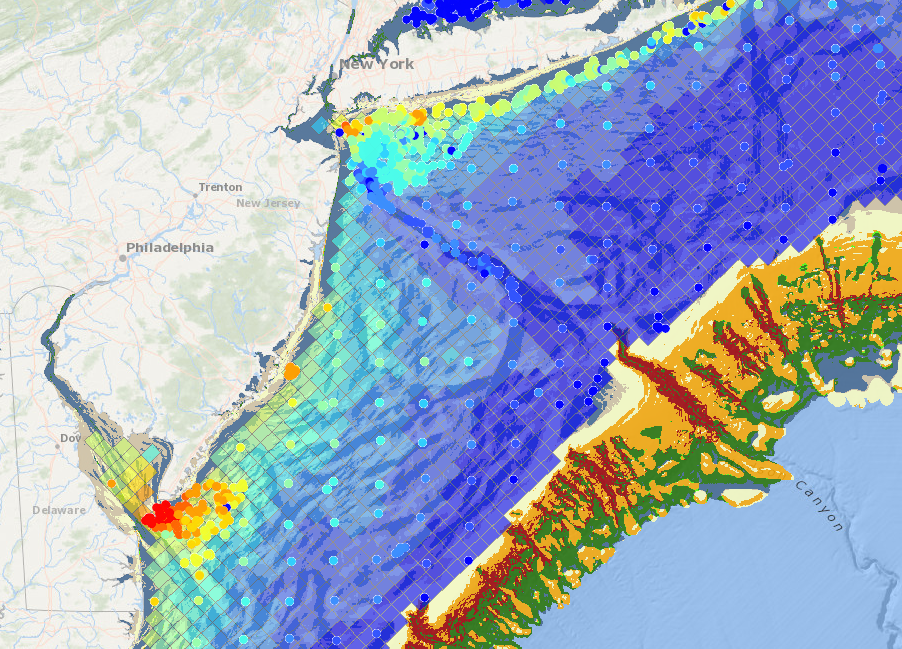
The Seabed Mobility and Seabed Shear Stress layers are based on research completed over the course of a year from May 2010 through May 2011. The Seabed Mobility map indicates the extent of movement that sediments on the ocean floor experience over the course of a year, with reds indicating areas where the materials tend to move a lot and blues indicating areas where they’re comparatively stationary. Users can click on any of the map for a pop-up window with the estimated bed mobility percentages by season and year at a specific point.
The Seabed Sheer Stress layer indicates the degree of interaction between waves/currents and the sea floor. Once again, reds show areas where shear stress is highest and darker blues represent areas where it is lowest. The two new USGS layers can provide a revealing snapshot of conditions along the ocean floor when activated in combination with the previously published Seabed Forms map.
More Oceanography Data
The Portal contains nearly 200 additional maps in its Oceanography theme, including three more bathymetry layers, eight years of maps depicting fronts and net primary productivity by season, ocean acidification monitoring data and more. Click on Oceanography in Marine Planner to browse them or visit our Data Catalog for a full listing.