
Two new maps in Marine Planner’s Socioeconomic theme provide a glimpse at which coastal counties’ economies are most closely linked with the ocean. Both maps are digitized, interactive versions of maps that first appeared in the Mid-Atlantic Regional Council on the Ocean’s (MARCO) 2018 report “Climate Change Vulnerabilities in the Coastal Mid-Atlantic Region.”
Total
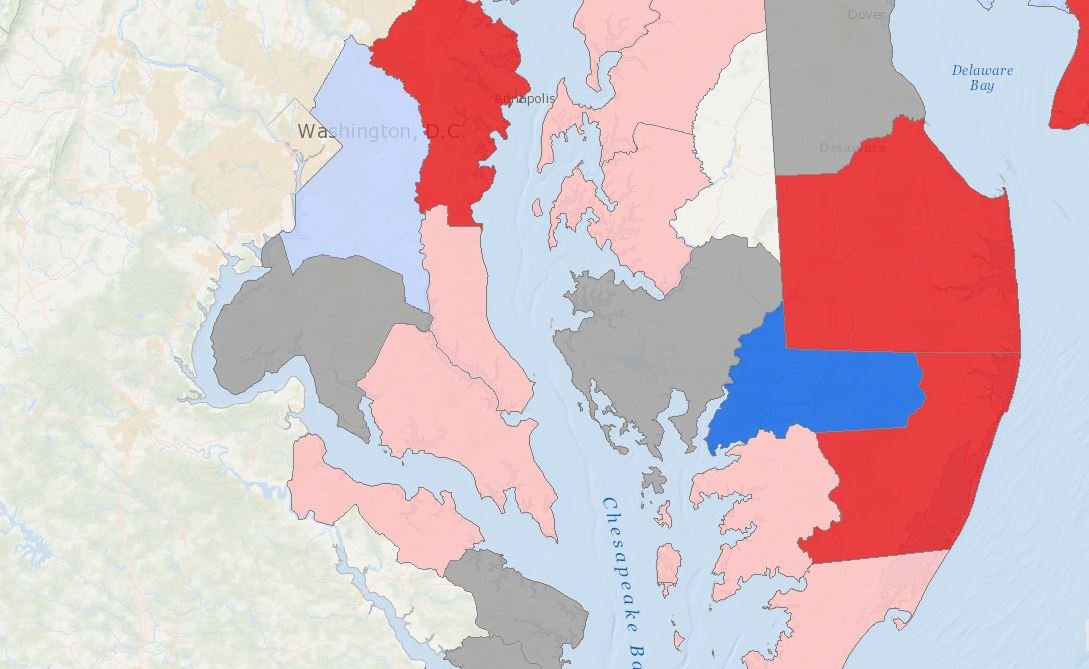
Seasonal Housing Units (2015) shows which counties had the most
seasonal homes in shore-adjacent Census tracts. Users can click on any coastal
county for a pop-up that presents the number of seasonal homes there. Across
the region, there were 439,000 seasonal units in shore-adjacent tracts in the
Mid-Atlantic region. New Jersey led the region with 116,000 units, followed by Maryland
(90,000), New York (70,000), Delaware (33,000) and Virginia (22,000).
Ocean Employment as Percent of County Employment (2015) indicates which counties’ job bases are most reliant on the Atlantic. Like the Total Seasonal Housing Units layer, this is a county-level map that summarizes underlying data at the shore-adjacent Census tract level. Users can click on any county for a pop-up containing the percentage for each area.
For the purpose of the report, the ocean economy was defined as comprising six sectors: marine construction, living resources, minerals, ship and boat building, marine transportation, and tourism and recreation. Together, these six sectors accounted for 628,755 jobs across the region.
The data were compiled for MARCO by the Research Group of the
Center for the Blue Economy at the Middlebury Institute of International
Studies at Monterey.